EPA’s Environmental Justice Tool Designed to Map, Protect Vulnerable Populations
May 23, 2022
Share

The Environmental Protection Agency (EPA) provides a fairly new mapping tool called EJScreen that helps identify geographical areas where vulnerable populations have higher environmental burdens to overcome.
The EPA says the goal of the online tool is to help provide an environment where all people enjoy the same degree of protection from environmental and public-health hazards and have equal access to the decision-making process to maintain a healthy environment in which to live, learn, work, and play.
The federal agency places particular emphasis on the public health and environmental conditions impacting people of color, low-income families, and Indigenous populations. These communities frequently bear a disproportionate burden of environmental harms and risks.
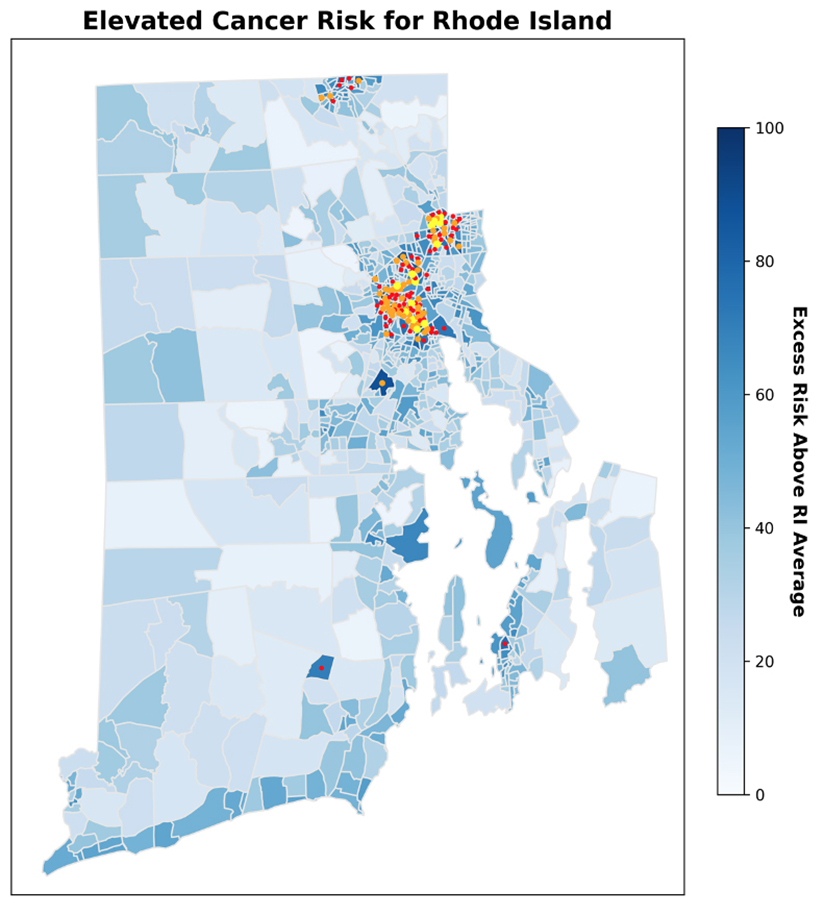
Two examples of the type of information that can be displayed using EJScreen are shown in the map above and the one below. The above map displays the relative cancer risk across Rhode Island from environmental air pollutants. The map makes it clear that low-income neighborhoods and communities where people of color are the predominate residents have a significantly elevated risk of cancer.
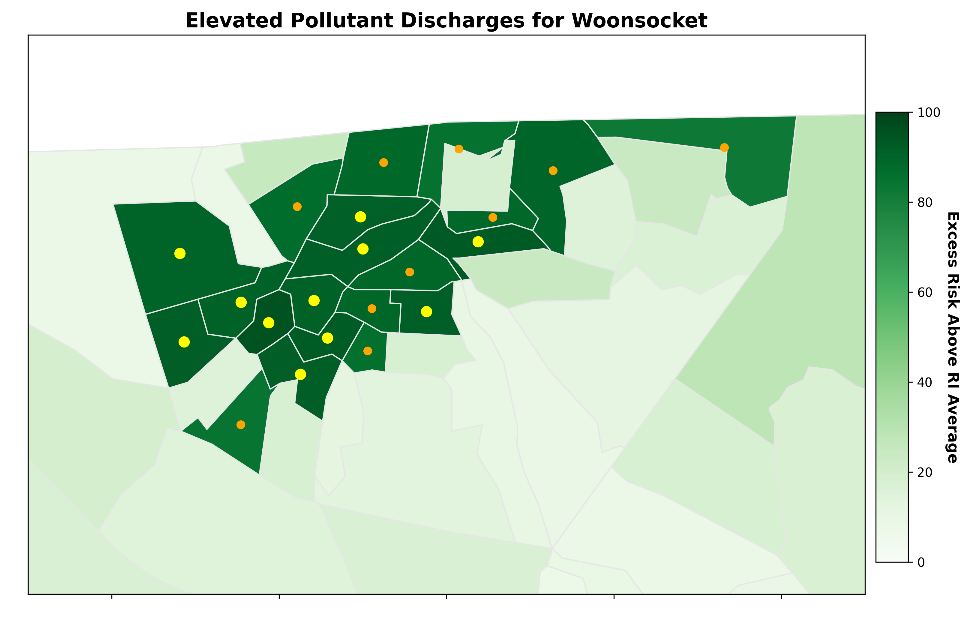
EJScreen users can also zoom in to study areas in more detail. For example, the map below shows where wastewater pollution discharges are highest in the city of Woonsocket.
An important first step to ensuring environmental justice for all is to identify the areas where people are most vulnerable or likely to be exposed to different types of pollution. EJScreen was developed to help ensure programs, policies, and resources are appropriately inclusive and consider the needs of communities most burdened by pollution, according to the EPA.
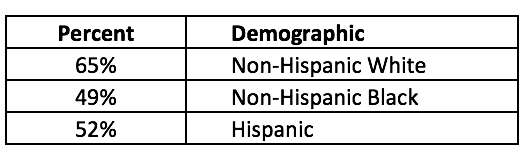
For example, the table to the right lists the disparities in how adults reported excellent or very good health in 2009.
EJ indexes
The EJ Index is given as a percentile and can be thought of as the additional number of susceptible individuals in the block group, beyond what you would expect for a block group with that size total population.
EPA says it is easiest to think of the average of these counts as “the susceptible individuals.”
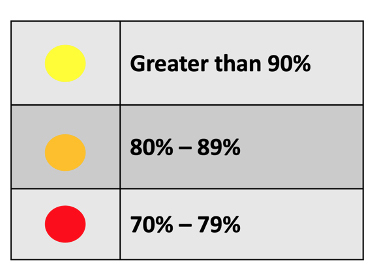
On the maps, locations with an index at least at the 70th percentile but less than the 79th are shown in red, while those at the 80th percentile but less than 89th percentile are orange, and those at the 90th percentile or above are shown in yellow.
Percentiles at or above the 90th percentile (yellow), call particular attention to those areas where the value is in the top 10% of the state.
EJScreen provides 12 indexes. Each index combines demographic information with a single environmental indicator, which helps identify communities that may have a high combination of environmental burdens and vulnerable populations.
The relationships between demographics, exposure, and susceptibility are complex. For example: children ingest more lead dust than adults; certain groups are less able to avoid exposures due to limited resources, language barriers, education, cultural practices or lack of information; cumulative previous exposure means a group is more likely to be closer to a threshold for adverse effects.
Therefore, to understand the actual health implications of any value requires looking at the actual data the indicator represents. High percentiles suggest a need to investigate further.
The most important reason to use EJScreen is to focus on key demographic groups that an expanding body of research has shown are more impacted by a given level of exposure to certain pollutants. For example:
People with lower incomes report fewer average healthy days than others.
Both lower income and people of color have higher asthma rates, particularly among children.
Coronary heart disease and stroke are elevated among Black people compared to other groups.
Infant mortality is higher among non-Hispanic Black, Indigenous, and Puerto Rican — but not other Hispanic — populations.
Groups with lower educational attainment, children, the elderly, and those with low socio-economic status, appear to be more susceptible to a given exposure to particulate matter.
Cardiovascular outcomes from elevated levels of lead in the blood appears to be stronger among Mexican Americans and non-Hispanic Black people than non-Hispanic White people.
Roger Warburton, Ph.D., is a Newport, R.I., resident. He can be reached at [email protected].
To view the series, click here.
Notes: Environmental Protection Agency (EPA) Environmental Justice Screening and Mapping Tool (Version 2.0). 2019 version 2.0. Retrieved: 02-04-2022, from https://ejscreen.epa.gov/mapper/. Demographic data is from the U.S. Census Bureau American Community 5-year Summary Survey (ACS). Rhode Island Census tract shapefiles are Cartographic Boundary Files from the U.S. Census Bureau.
Correction (May 27, 2022): An earlier version of a map in this article identified the elevated pollutant discharges in the incorrect municipality.