Storm Pollution Remains Invisible in Providence’s Watersheds. It’s Because Our Monitoring Systems Aren’t Built to Capture It.
March 18, 2026
Share
PROVIDENCE – On a dry morning along the Moshassuck River, the water looks polished and undisturbed. But a single storm transforms its chemistry – bacteria, organic carbon, metals and sewage-laden runoff enter in sudden pulses that vanish almost as quickly as they arrive.
These hidden changes during rainstorms sit at the center of efforts to understand Providence’s urban watersheds. Researchers and community groups agree that monitoring matters, but water quality data collected by federal, state and city agencies rarely captures the moments when pollution peaks. Without coordination between formal monitoring systems and the fine-scale work of local organizations, the city cannot fully see how storm events reshape its rivers.
Federal and state reports show impaired segments of the Moshassuck and Woonasquatucket rivers, with elevated levels of E. coli, phosphorus, nitrates and heavy metals. Residents often notice post-storm cloudy water and sharp odors under bridges. Yet many datasets rely on scheduled sampling rather than storm-responsive monitoring, so readings often occur when contaminants appear low. Agencies acknowledge impairment, but the timing and intensity of contamination remain difficult to document.
Local organizations are filling these gaps. The Providence Resilience Partnership, a partnership between the Woonasquatucket River Watershed Council and the Institute at Brown for Environment and Society (IBES), aims to capture storm-driven surges that traditional water sampling systems overlook.
IBES researchers describe Providence’s rivers as highly reactive because of dense impervious surfaces. Paved streets and industrial yards leave rainfall with few places to soak in, sending stormwater sweeping into the river within minutes.
“You can sit next to the Moshassuck during a storm and see it rise two feet,” said geochemist and postdoctoral researcher Gavin Piccione. “We watch the river change. There’s a hundredfold increase in garbage coming down, and you get a lot more metals moving through the system.”
Traditional monitoring frameworks are not built to capture these short-lived bursts. According to Piccione, much of the scientific literature on nutrient cycling focuses on natural landscapes where rivers shift gradually. Providence’s chemistry behaves differently – urban stormwater delivers pulses of carbon from sewage overflow and decaying runoff that has interacted with streets and rooftops.
“There’s a lot of organic carbon coming from distinctly urban sources during storms,” Piccione said. “Combined sewage overflow remains a big factor.”
The state’s Integrated Water Quality Reports and EPA datasets capture broad patterns, but their sampling schedules rarely align with periods when contamination peaks. Many measurements are only taken during weekday office hours or at long-term stations that do not sample during storms, due to logistical challenges. Scientists know pollution rises after rainfall, yet publicly available data often reflects only post-storm calm.
Providence’s watersheds still bear the legacy of an industrial past. Textile mills, metal shops, laundromats and chemical facilities once lined the rivers. Though industry has largely receded, its toxic footprint remains. IBES researchers now sample soil and water near legacy sites to see how old pollutants still shape river chemistry.
Early findings are mixed: a remediated Superfund site along the Woonasquatucket shows some of the lowest pollutant levels in the dataset, demonstrating the cleanup’s effectiveness. Elsewhere, contamination is more complex.
“You might find heavily polluted soil,” Piccione said, “but the key question is bioavailability, and whether that metal can actually move, enter the river, or affect human health. That depends heavily on land use.”
State and federal databases note contamination but rarely capture such nuances. Without local sampling, policymakers lack the detail needed to target risks. For years, the Woonasquatucket River Watershed Council (WRWC) has filled these gaps through community monitoring.
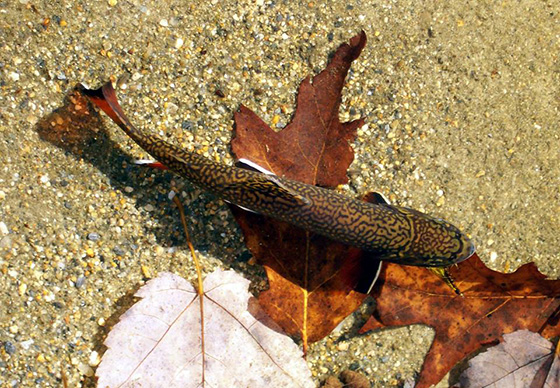
The WRWC’s bacteria sampling program tracks E. coli, showing sharp post-rainfall spikes. The WRWC also leads cleanup days, herring counts and electrofishing surveys. Though designed for stewardship, these efforts yield data federal agencies lack, revealing which river stretches collect plastics, which tributaries move debris, and how storm surges unfold on the ground.
“When people see for themselves what pollution ends up in the river, they are more likely to be aware of littering and take action to prevent pollution in their day-to-day lives,” said Colleen Keenan, an environmental educator at the Woonasquatucket River Watershed Council. She says the WRWC’s storm drain marking program helps residents understand that stormwater bypasses treatment systems entirely.
The WRWC also translates technical information from state datasets, university research and its own monitoring into newsletters, presentations and school programs. Keenan says these channels give residents access to contamination information that official reports do not always present clearly. The city’s 2024 Stormwater Management Plan outlines broad priorities, but its categories often diverge from the fine-scale observations WRWC collects, says Keenan.
A major challenge is that water quality data across federal, state and local sources is not collected in the same way. Inconsistencies make it difficult to compare numbers or understand how contamination moves during storms. The EPA’s Water Quality Portal aggregates readings from many programs, yet many entries come from long-term stations that sample only every few weeks, capturing baseline conditions rather than storm spikes. This often results in moderate bacteria or nutrient levels even during seasons when local groups record sharp increases.
The state Department of Environmental Management relies on a separate system. Its Integrated Water Quality Reports use targeted sampling, but frequency varies by site. They test some tributaries several times a season; others only once or twice a year. RIDEM’s bacteria testing also often sets minimum detection limits higher than those used by local groups, meaning smaller spikes may never appear in state records. As a result, a segment may appear “meeting criteria” in state data on the same day WRWC records E. coli levels above recreational guidelines.
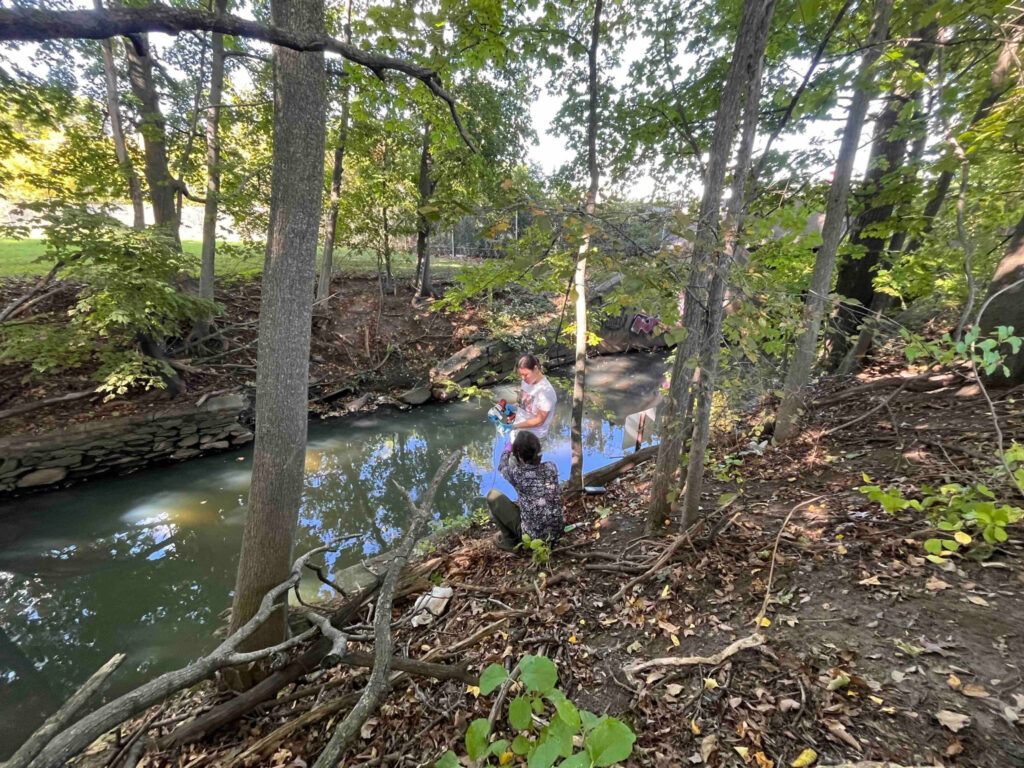
Community organizations add another layer. WRWC sites sit at footbridges, bike paths and access points outside federal and state networks. Their sampling is more frequent, especially during wet weather, and often takes place within hours of a storm. This produces rapid fluctuations that federal and state datasets do not capture.
Different organizations also measure different things. EPA stations focus on nitrogen and phosphorus; state datasets emphasize bacteria and metals; IBES measures organic carbon, dissolved metals and storm-driven nutrient pulses that neither the EPA or state systems capture consistently.
Together, these differences create a fragmented picture. Each dataset captures part of the river’s behavior but not its full volatility. Without context, results can appear contradictory, though each system measures what it’s designed to.
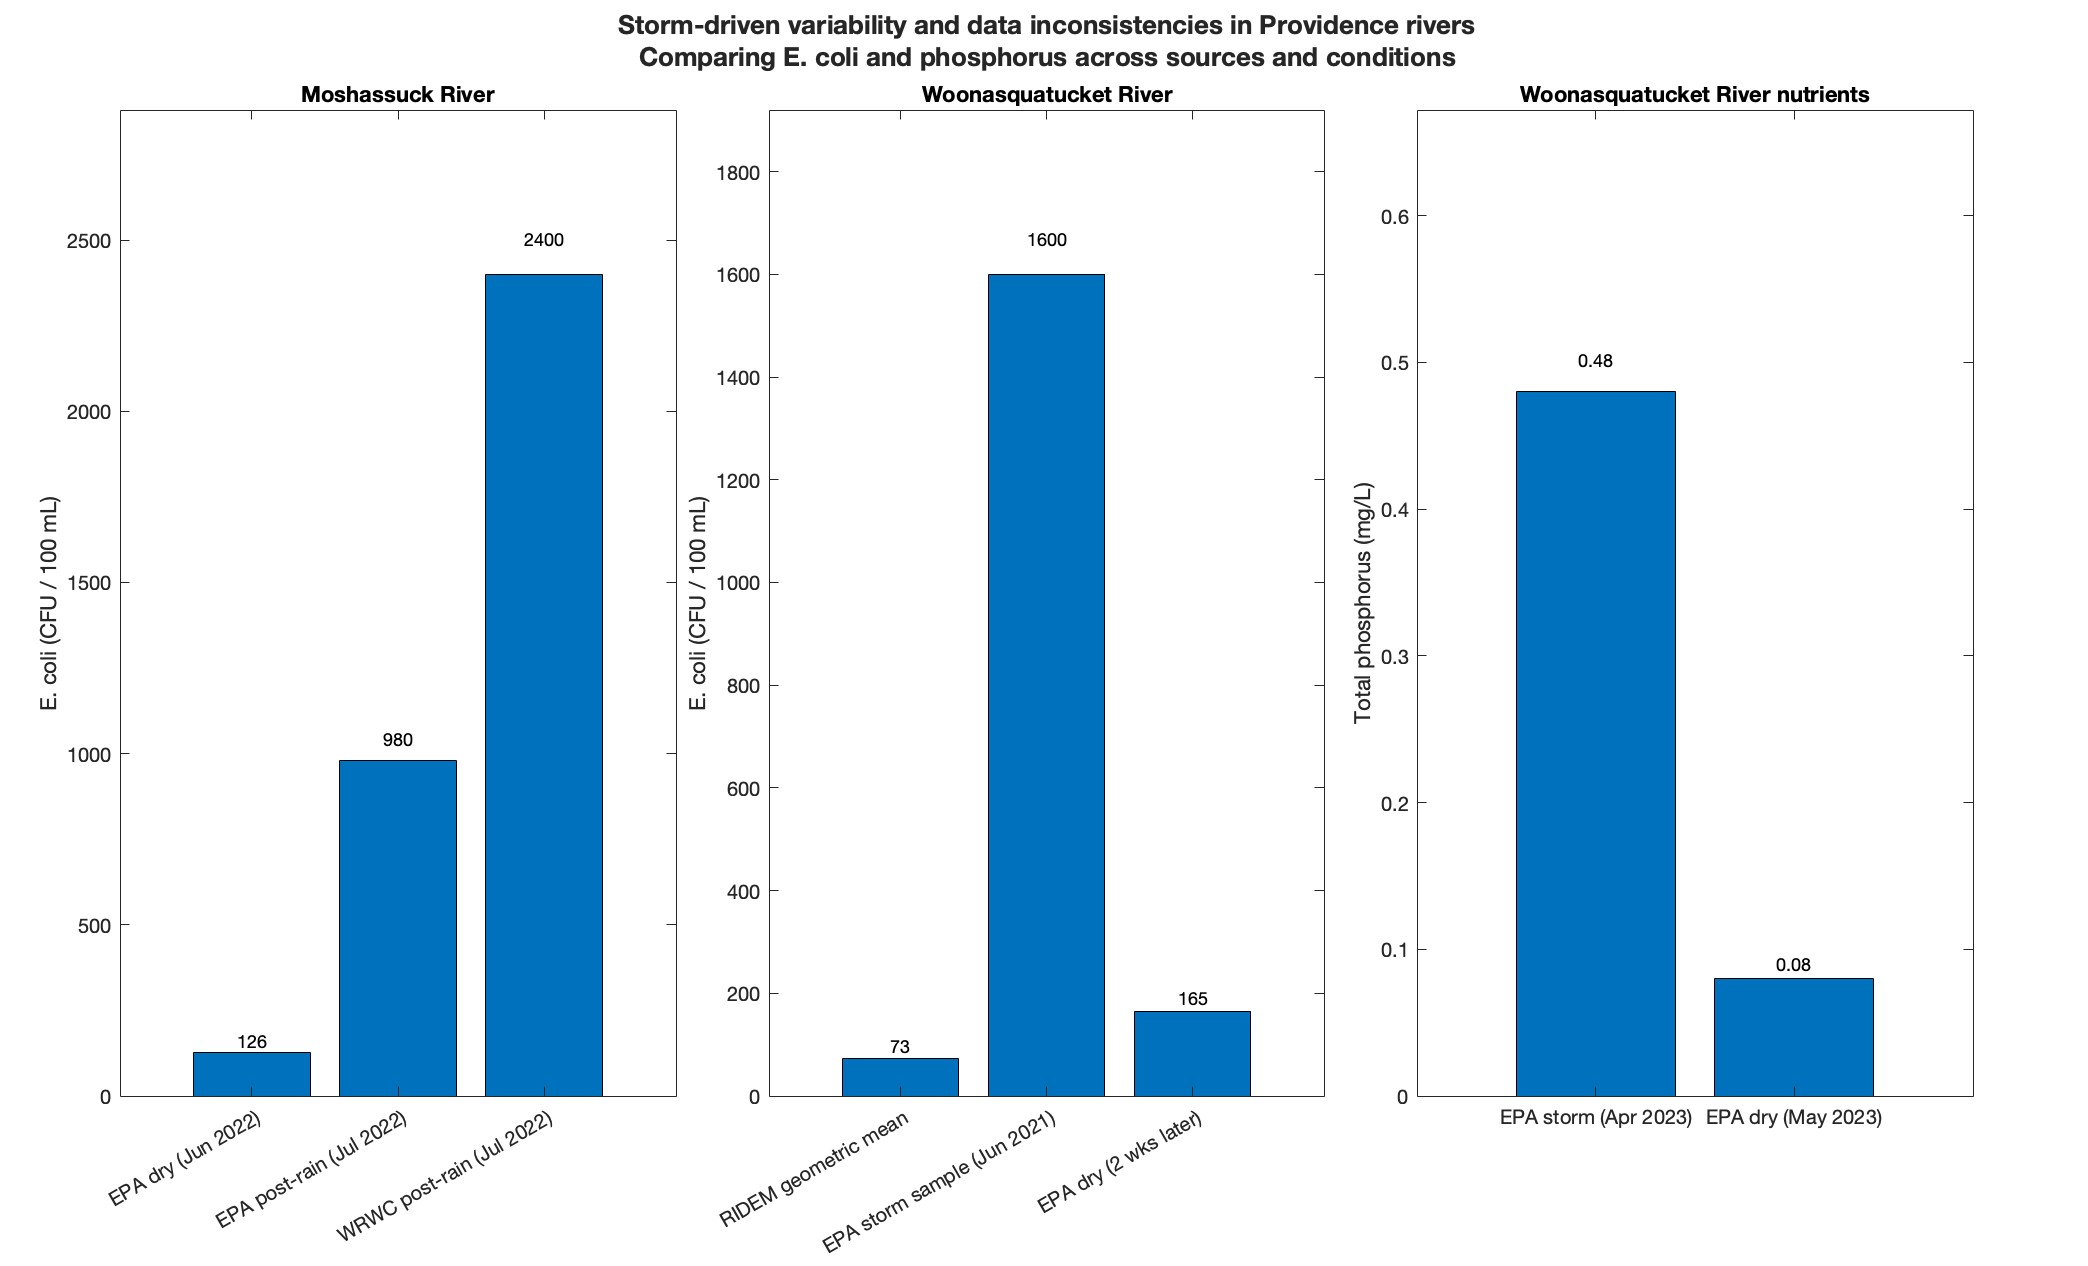
Recent monitoring underscores the mismatch: EPA Water Quality Portal records from 2021–2023 show tenfold swings in contamination depending on sampling time. On the Moshassuck River, one EPA station measured E. coli at 126 CFU per 100 milliliters during a dry June 2022 sample but 980 CFU two days after July rainfall.
The Woonasquatucket shows the same pattern. DEM’s 2022 assessment reported a geometric mean of 73 CFU per 100 milliliters for one segment, while an EPA sample during a June 2021 storm at a nearby site recorded 1,600 CFU, dropping to 165 two weeks later in dry weather. Nutrients vary just as sharply: an April 2023 EPA sample found total phosphorus at 0.48 milligrams per liter, nearly five times the following month’s dry-weather reading. These numbers illustrate how timing, frequency and location can distort the picture of storm-driven contamination.
As storms intensify with climate change, the gap between monitored conditions and lived experience will widen. By combining WRWC’s community sampling with IBES’s chemical and hydrologic modeling, researchers like Piccione aim to pinpoint contamination hotspots.
“We’re trying to answer these questions with a more fine-toothed comb,” Piccione said. “The river integrates everything that happens upstream.”
Both Piccione and WRWC stress that communication matters. Elevated pollutant levels don’t always mean direct risk; bioavailability, exposure pathways and land use shape how contaminants move. “It’s important to give information responsibly,” Piccione said. “You want to say: here are the issues, here are the consequences, and here’s how people can protect themselves.”
To respond effectively, Providence needs storm-responsive monitoring, nuanced policies, and strong partnerships between agencies and local organizations. The WRWC–IBES collaboration offers a model: local groups bring access and knowledge, researchers bring analytical tools, and agencies bring authority. Survey by survey, the combined work of researchers and community groups is revealing the clearest picture yet.
For residents like Maximus Namba, who has lived in Rhode Island most of his life, that picture is eye-opening. Standing near the Woonasquatucket after a late-summer storm, he said he never realized that groups like the Woonasquatucket River Watershed Council were out measuring what happens when the water turns brown.
“I just thought the city checked the water once in a while,” Namba said. “I didn’t know people were out here after storms taking samples.”
Learning about that monitoring changed how he sees the river. “When you grow up here, you get used to the smell after it rains,” he said. “You think that’s just how the river is. But if someone’s out there tracking it, maybe we’re close to a fix.”
For Namba, that awareness bridges the gap between numbers on a page and the water he’s known his whole life. “It makes you realize the river isn’t just background,” he said. “It reacts to what we do. We might finally start taking better care of it.”
This story was published as part of a collaboration between ecoRI News and students in Brown University’s Science Journalism class. The stories examine the science, history, and human experiences connected to the Ocean State’s rivers — from water quality and wildlife restoration to flooding, pollution, social justice, and the communities working to protect them. To read more of these stories, click here.