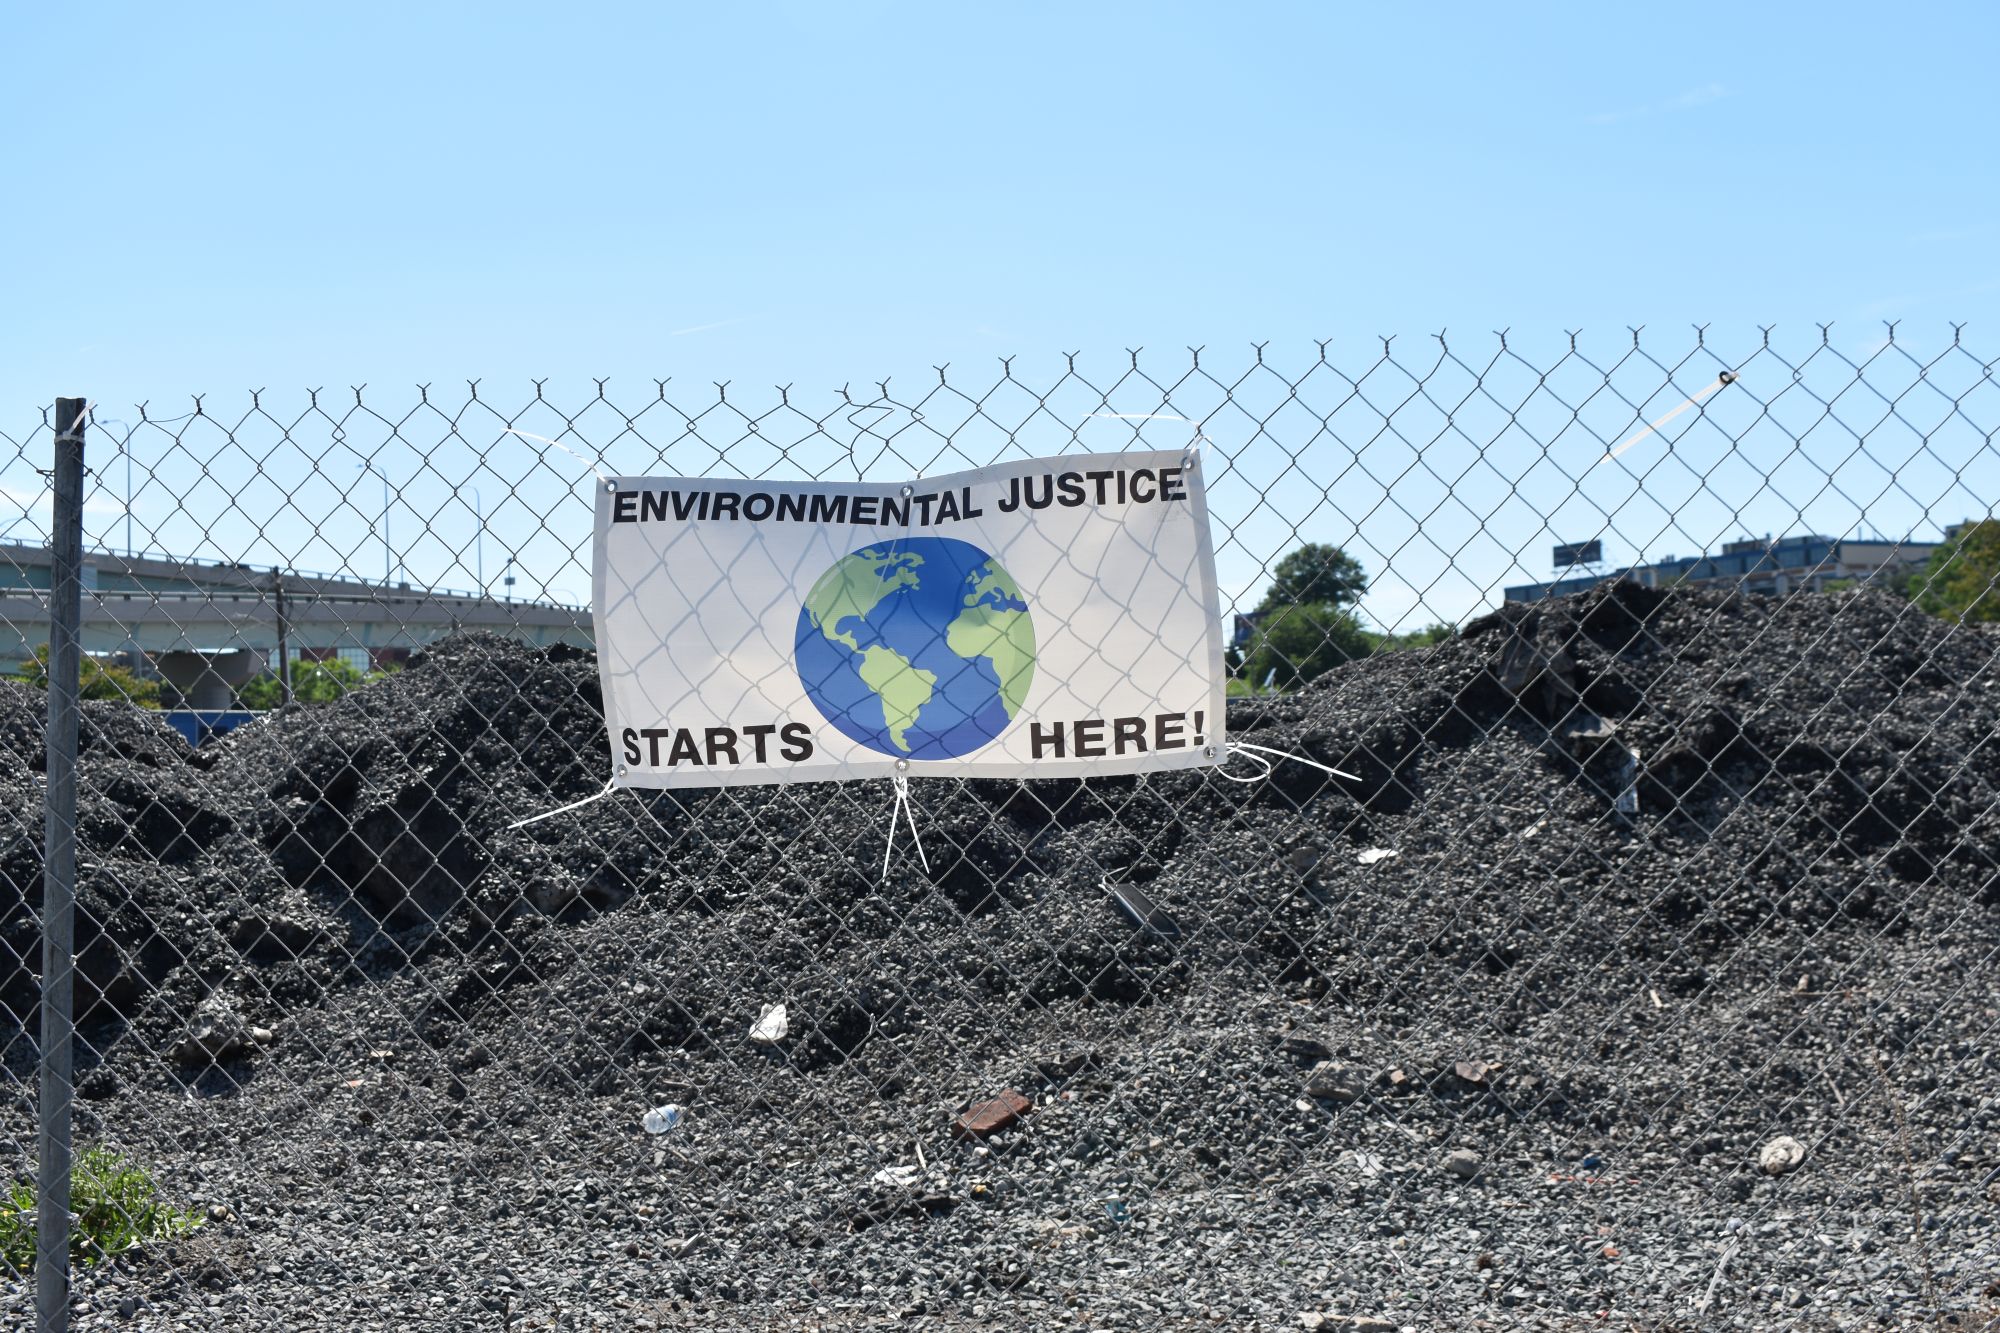
Study Finds Black People in Rhode Island Exposed to Higher Levels of Air Pollution
June 16, 2021
Share
A new study strengthens the fact that, in Rhode Island, people of color have been exposed to significantly higher levels of air pollution than White people for decades.
Furthermore, all major emissions categories contribute to the systemic air pollution exposure disparity experienced by people of color, including industry, agriculture, electric utilities, gasoline and diesel vehicles, construction equipment and residential sources.
Each of the above pollution sources contributes to fine-particle air pollution (PM2.5), defined as particulate matter 2.5 micrometers or less in diameter.
The study was led by University of Illinois Urbana-Champaign civil and environmental engineering professor Christopher Tessum and published in the journal Science Advances.
The damaging effects of PM2.5 particles are well established. Since the particles are so small, they travel deeply into lungs and cause coughing, sneezing, runny nose and shortness of breath. PM2.5 particles also worsen asthma and heart disease and increase hospital admissions for respiratory and cardiovascular patients. Children and the elderly are particularly sensitive to the effects of PM2.5.
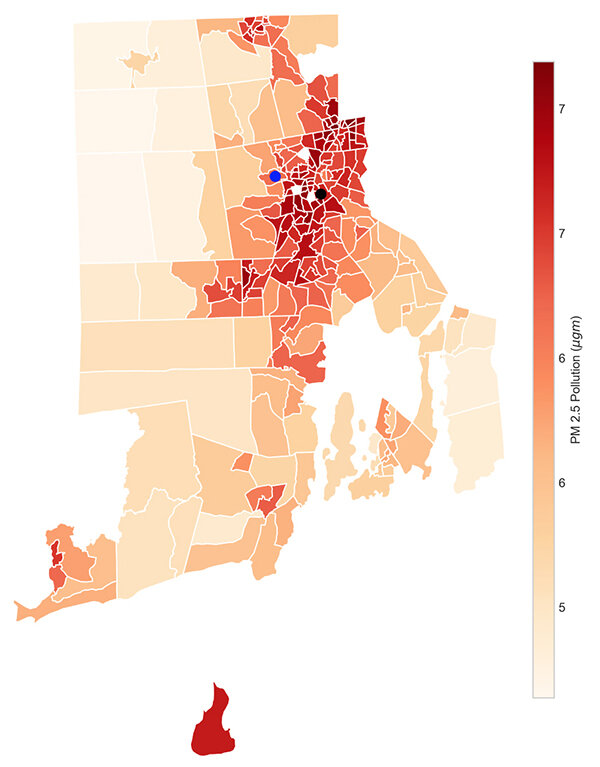
Tessum’s team combined Environmental Protection Agency data on spatial air pollution patterns with residential population data from the U.S. Census Bureau to identify differences in exposure by race and income. Rhode Island’s PM2.5 pollution levels are plotted in Figure 1.
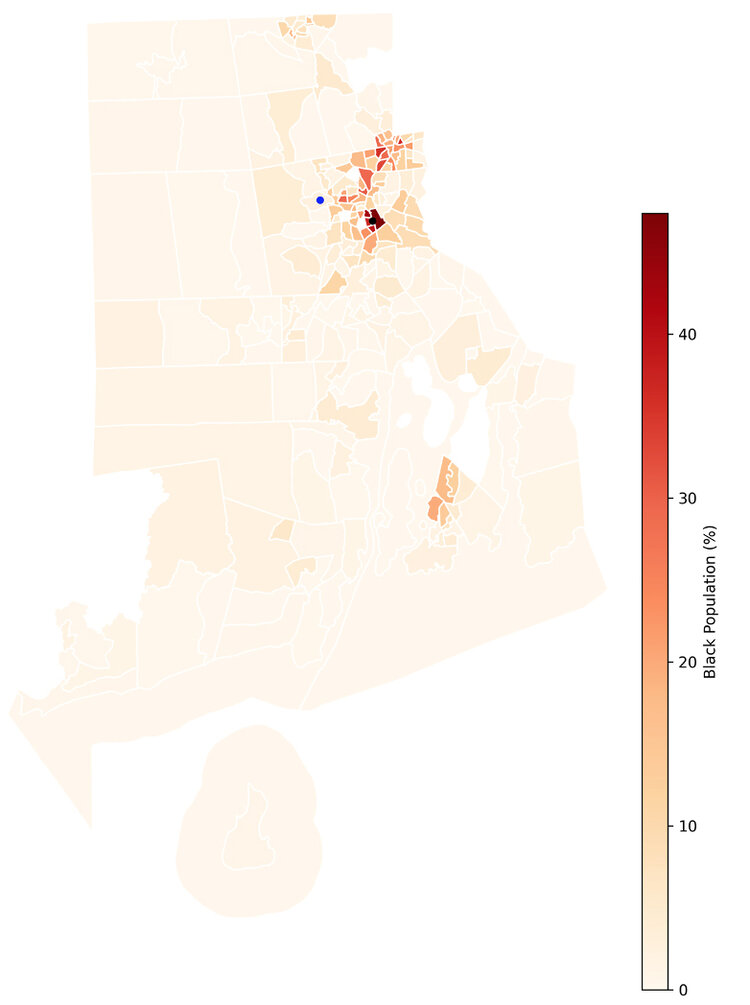
It’s striking to compare the pollution levels in the above figure with Rhode Island’s Black population distribution, which is shown in Figure 2 below.
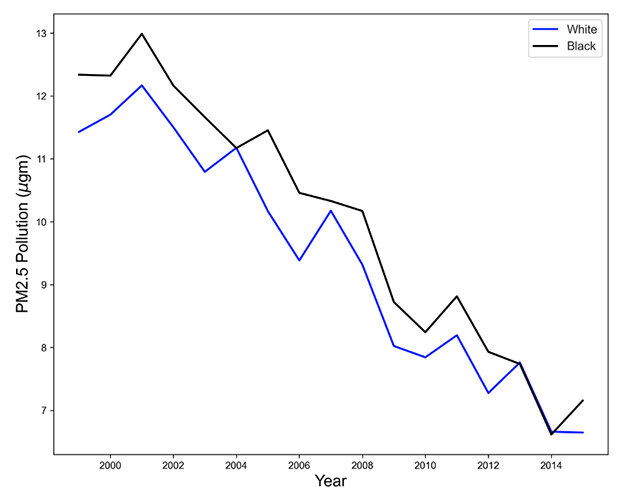
Pollution levels for PM2.5 have been declining across Rhode Island since 2000, but the decline in areas with higher concentrations of Black people is less than the decline in areas with higher concentrations of White people. Figure 3 demonstrates this stark reality.
The black line shows decreasing PM2.5 pollution levels over time for the census tract marked by the black dot in Figures 1 and 2, where the Black population is 47.4 percent. The blue line represents decreasing PM2.5 pollution levels for the census tract marked by the blue dot, where the Black population is 2.8 percent.
Across the United States, White people are exposed to lower-than-average PM2.5 concentrations from all sources — 60 percent of their total exposure. People of color experience greater-than-average PM2.5 exposures — 75 percent of their total exposure. This disparity exists at the national, state and local levels and for people within all income levels.
Julian Marshall, a co-author of the study and a professor of civil and environmental engineering at the University of Washington, said, “The inequities we report are a result of systemic racism: Over time, people of color and pollution have been pushed together … for all types of emissions.”
Joshua Apte, another a co-author who is a professor of civil and environmental engineering at the University of California, Berkeley, said, “We were struck by how these systemic disparities exist for people of color not only in certain neighborhoods (but) within urban and rural areas, many distinct U.S. regions, and for people living within almost all American cities.”
Tessum noted people often assume that when there is a systematic racial or ethnic disparity, the underlying cause is a difference in income. However, the study found the disparity cut across all income levels, and reinforced previous findings that race, rather than income, is what truly drives air pollution-exposure disparities.
Roger Warburton, Ph.D., is a Newport, R.I., resident. He can be reached at [email protected].
References: “PM2.5 polluters disproportionately and systemically affect people of color in the United States,” Christopher W. Tessum, David A. Paolella, Sarah E. Chambliss, Joshua S. Apte, Jason D. Hill, and Julian D. Marshall, Science Advances, 28 Apr 2021, Vol. 7, no. 18. Available online and DOI: 10.1126/sciadv.abf4491; a video describing this research is available here.