Century of Data Show Narragansett is an Ocean State Hot Spot
September 16, 2019
Share
Unsung heroes at Narragansett Pier have recorded the temperature every day since before 1900. Their dedication and diligence were recently instrumental in revealing important consequences for all Rhode Islanders.
An August article in The Washington Post demonstrated that regional warming rates differ considerably across the United States. It may come as a shock to hear that Rhode Island is the first state in the Lower 48 whose average temperature rise has already exceeded 2 degrees Celsius (3.6 degrees Fahrenheit).
However, to determine the rise in temperature during the past century, one needs reliable, accurate data on the temperature from 100 years ago. This is where the Narragansett Pier temperature data are critical.
The Narragansett data are remarkably complete, with just two missing years during World War I. It’s hard to detect an overall temperature rise from the above graphic because of the monthly variation. Therefore, in the graphic below, we separated out the data for just the months of July from 1900 to 2018. We can learn several things from that.
Because we have data as far back as 1900, we can establish a baseline temperature by averaging the July temperatures from 1900 through 1904 — represented by the dashed blue line below. Now we have a baseline with which to compare temperatures in later years.
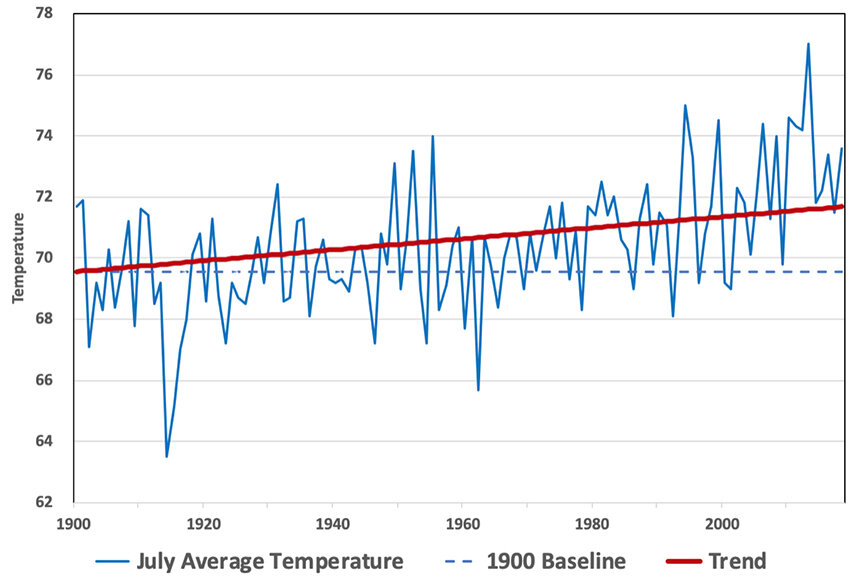
Although there are still variations, a rise in temperature over time is now more evident. Scientists typically measure a trend with a linear fit to the data, which is shown by the red line above.
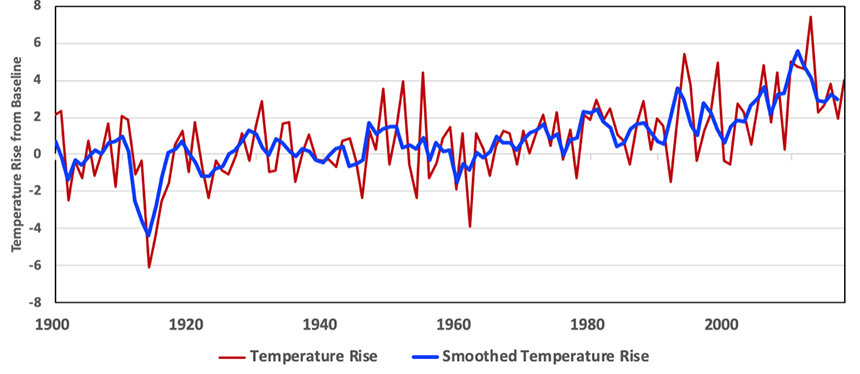
The above graphic only shows the July temperatures, and to be more accurate and convincing, we should display all months. We begin by calculating the temperature rise above the baseline for all months. For July, that is shown in the graphic below.
Now we can plot 12 months’ worth of data on a clock face, with January at noon, February at 1 o’clock, etc. Each year produces one ring. The black circle represents the baseline for each month. The distance between the yellow line and the black circle represents the temperature difference between the actual monthly temperature and the baseline for that month.
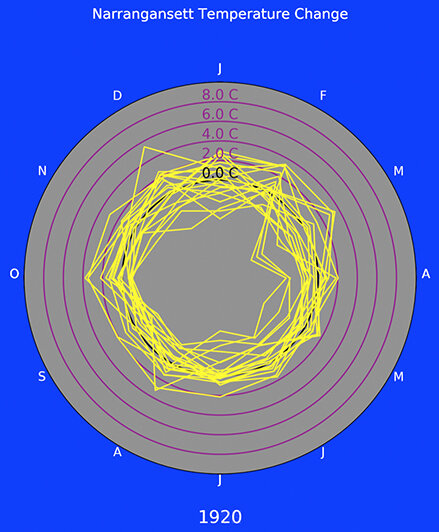
The graphic to the right shows the temperature deviations for the years 1900 through 1920. While the yellow lines vary around the zero-temperature deviation circle, the average temperature hasn’t risen much above the baseline.
The graphic at the end displays the entire Narragansett Pier temperature data set, 1900 through 2018. The changes in colors denote the rise in the average temperature: salmon, greater than 0.5 degrees Celsius; pink, greater than 1 degree; red, greater than 1.5 degrees; maroon, greater than 2 degrees.
As the temperature rises, the rings move further out and clearly show the rise in temperature at Narragansett Pier during the past 100 years.
While the graphic below shows only the Narragansett data, it’s a vivid example of temperatures across the Northeast increasing faster than the global average.
So why has the temperature in Narragansett increased so much?
One clue is that Narragansett Bay has warmed 2.9 degrees Fahrenheit, which may not seem like much, but it was significant enough to drive many lobsters north in search of cooler water. Rhode Island’s lobster catch has plummeted 75 percent in the past two decades.
Also, with 420 miles of coastline, Rhode Island is particularly vulnerable to the vagaries of the Gulf Stream, which contains more water than all of the world’s rivers combined. The melting of Arctic ice may have pushed the Gulf Stream closer to Rhode Island, bringing more warm water and hotter temperatures onshore.
Whatever the explanation, the Narragansett data show the climate crisis has already reached Rhode Island.
Roger Warburton, Ph.D., is a Newport, R.I., resident.
Categories
Join the Discussion
View Comments


Your support keeps our reporters on the environmental beat.
Reader support is at the core of our nonprofit news model. Together, we can keep the environment in the headlines.