Narragansett Bay Beach Closures Trending Downward
May 15, 2017
Share
Beaches are a critical component of Narragansett Bay’s recreational appeal, and beach closures reduce the quality of life for both residents and tourists. Pathogens in recreational waters and the resulting beach closures are primarily due to contaminants in wastewater and stormwater, according to the Narragansett Bay Estuary Program.
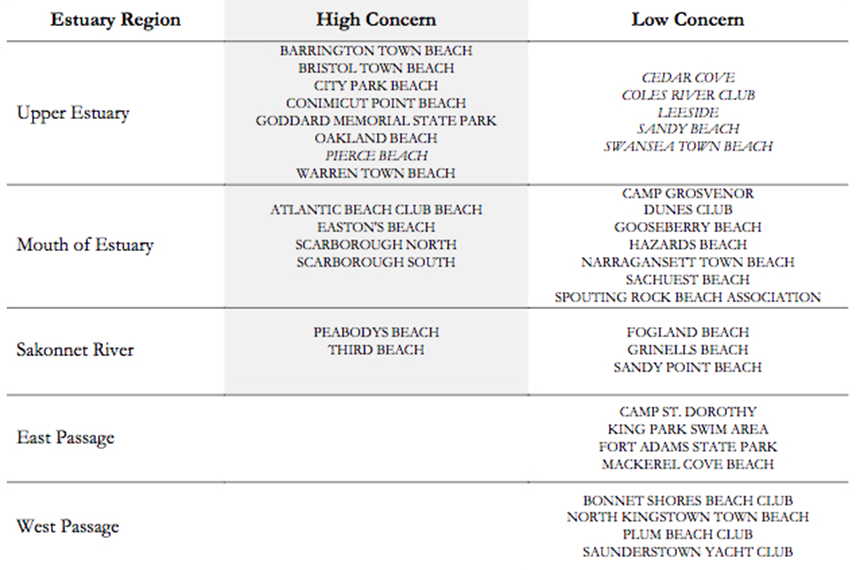
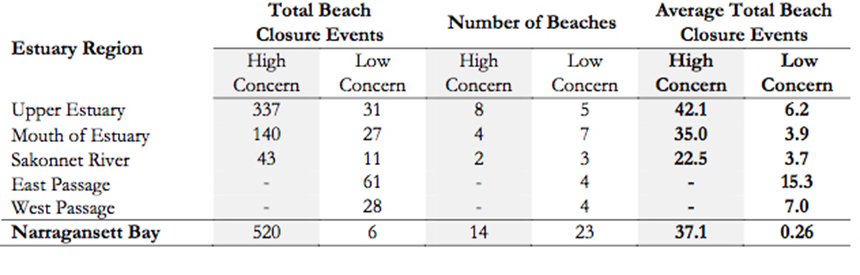
Tracking beach-closure events in Narragansett Bay serves as an indicator of public-health protection and of ecosystem health. This indicator, developed in collaboration with state health departments, classifies marine beaches as “High Concern” or “Low Concern,” based on the level of use, monitoring frequency and historic rates of closures.
The Narragansett Bay Estuary Program’s draft report State of the Bay and its Watershed assesses 24 indicators throughout the bay and its watershed — some 60 percent of it is in Massachusetts — based on best available science and current research efforts.
Public comments on the draft report will be accepted until the close of business May 22. Comments should be e-mailed to [email protected]. The Narragansett Bay Estuary Program (NBEP) will revise and finalize the report and prepare a summary based on public feedback.
ecoRI News recently went through the report. Three indicators — beaches, recreation and shellfishing — provide a glimpse into Narragansett Bay’s public-health concerns. Here is a look at those three areas:
BEACHES
Water at public beaches is sampled during the summer season — Memorial Day through Labor Day — and analyzed using Enterolert, a defined substrate method to estimate counts of viable enterococci. For beaches in Rhode Island, the single sample standard is 60 colony forming units (cfu) per 100 milliliters of salt water.
Prior to 2015, however, the standard was 104 cfu per 100 ml for all marine beaches. In Massachusetts, the state health department continues to use the standard for enterococci in marine waters at 104 cfu per 100 ml for a single sample and 35 cfu per 100 ml for the geometric mean, which is calculated based on the last five non-rain impacted samples over a 30-day period.
For all Massachusetts beaches, any sample that is above the state standard is considered unsafe for swimming. For Rhode Island beaches, exceeding the standard is a trigger for beach closure consideration. Beach closures in Rhode Island take additional factors into account, including history of contamination, precipitation, flushing rates and any additional evidence of contamination.
Regional analysis of 16 years of marine beach closure data in Massachusetts and Rhode Island revealed a striking record of numerous beach-closure events concentrated among the eight High Concern beaches in the upper estuary in Narragansett Bay, a region with high pathogen loading.
RECREATION
Water-quality conditions for recreational use, such as swimming and boating, is a public-health indicator focused on the risks of fecal pathogen contamination. Fecal coliforms, escherichia coli, and enterococci are considered primary indicators for the presence of human pathogens in water. Exposure to harmful microorganisms through swimming and boating can cause health impacts such as gastroenteritis and sore throats, or even meningitis and encephalitis. Fecal pathogens are the leading cause of water-quality impairment in the country.
In the Narragansett Bay watershed, bacterial pollution is often present due to stormwater runoff and wastewater treatment systems, and can be magnified by increased impervious cover and precipitation. Most of the estuarine waters of Narragansett Bay (85 percent) were classified as acceptable for recreational use. More freshwater streams were impacted by pathogens (36 percent) than were acceptable for recreational use (20 percent).
The Pawtuxet River basin supports the greatest extent of acceptable fresh waters and the least relative extent of waters impacted by harmful bacteria. However, more than 40 percent of all freshwater bodies in the Narragansett Bay watershed weren’t assessed for water quality relating to recreational use, most notably in the Taunton River basin, where 60 percent of fresh waters remained unassessed.
Overall, estuarine waters in Narragansett Bay largely support recreational uses, with 85 percent classified as acceptable for swimming and boating. The Providence River estuary, the Palmer River, several coves within Greenwich Bay, and Newport Harbor are all areas that were exceptions to good water quality and were classified as impacted for swimming and other recreational uses.
Additionally, while the northeastern portions of Mount Hope Bay near Fall River, Mass., remained of unknown water quality, the southeastern portion of Mount Hope Bay was also impacted by pathogens. These areas impacted by pathogens should be a focus for water-quality improvements.
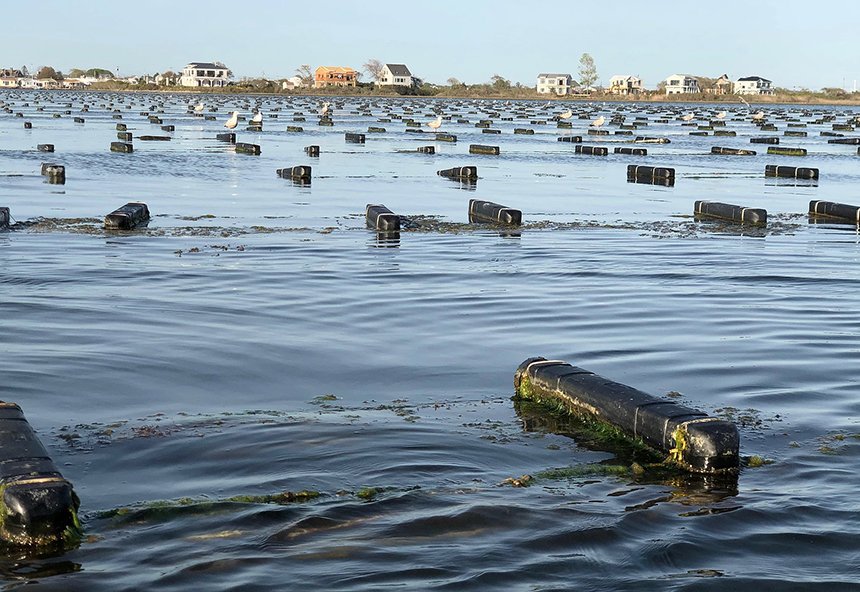
SHELLFISHING
Shellfishing for oysters and quahogs in Narragansett Bay is an important economic and recreational activity, and it’s highly dependent on favorable water quality. The importance of water quality for shellfishing was recognized more than a century ago, when water pollution was a primary cause of the collapse of a vibrant oyster industry.
Today, some key stressors that result in prohibited areas for shellfishing include urban stormwater runoff and pathogen loading from failing wastewater treatment systems.
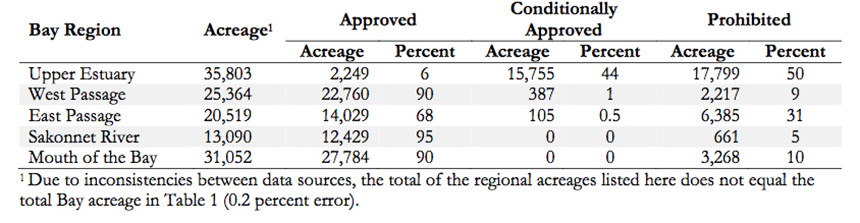
The most notable changes in shellfishing areas in Narragansett Bay occurred in the upper estuary during the past decade. Acreage of conditionally approved growing areas began to increase in 2000 and continued this trend through 2015, while prohibited areas declined at the same rate from 2005 through 2015. These changes in the upper estuary suggest an improvement in water-quality conditions. Ninety-seven percent of the 16,297 acres of conditionally approved areas in the entire bay occurred in the upper estuary.
Editor’s note: This is the third of three stories analyzing the draft report.