What Does a ‘100-Year Storm’ Mean These Days?
Climate change is shifting the way scientists calculate and talk about severe weather risks
June 28, 2024
Share
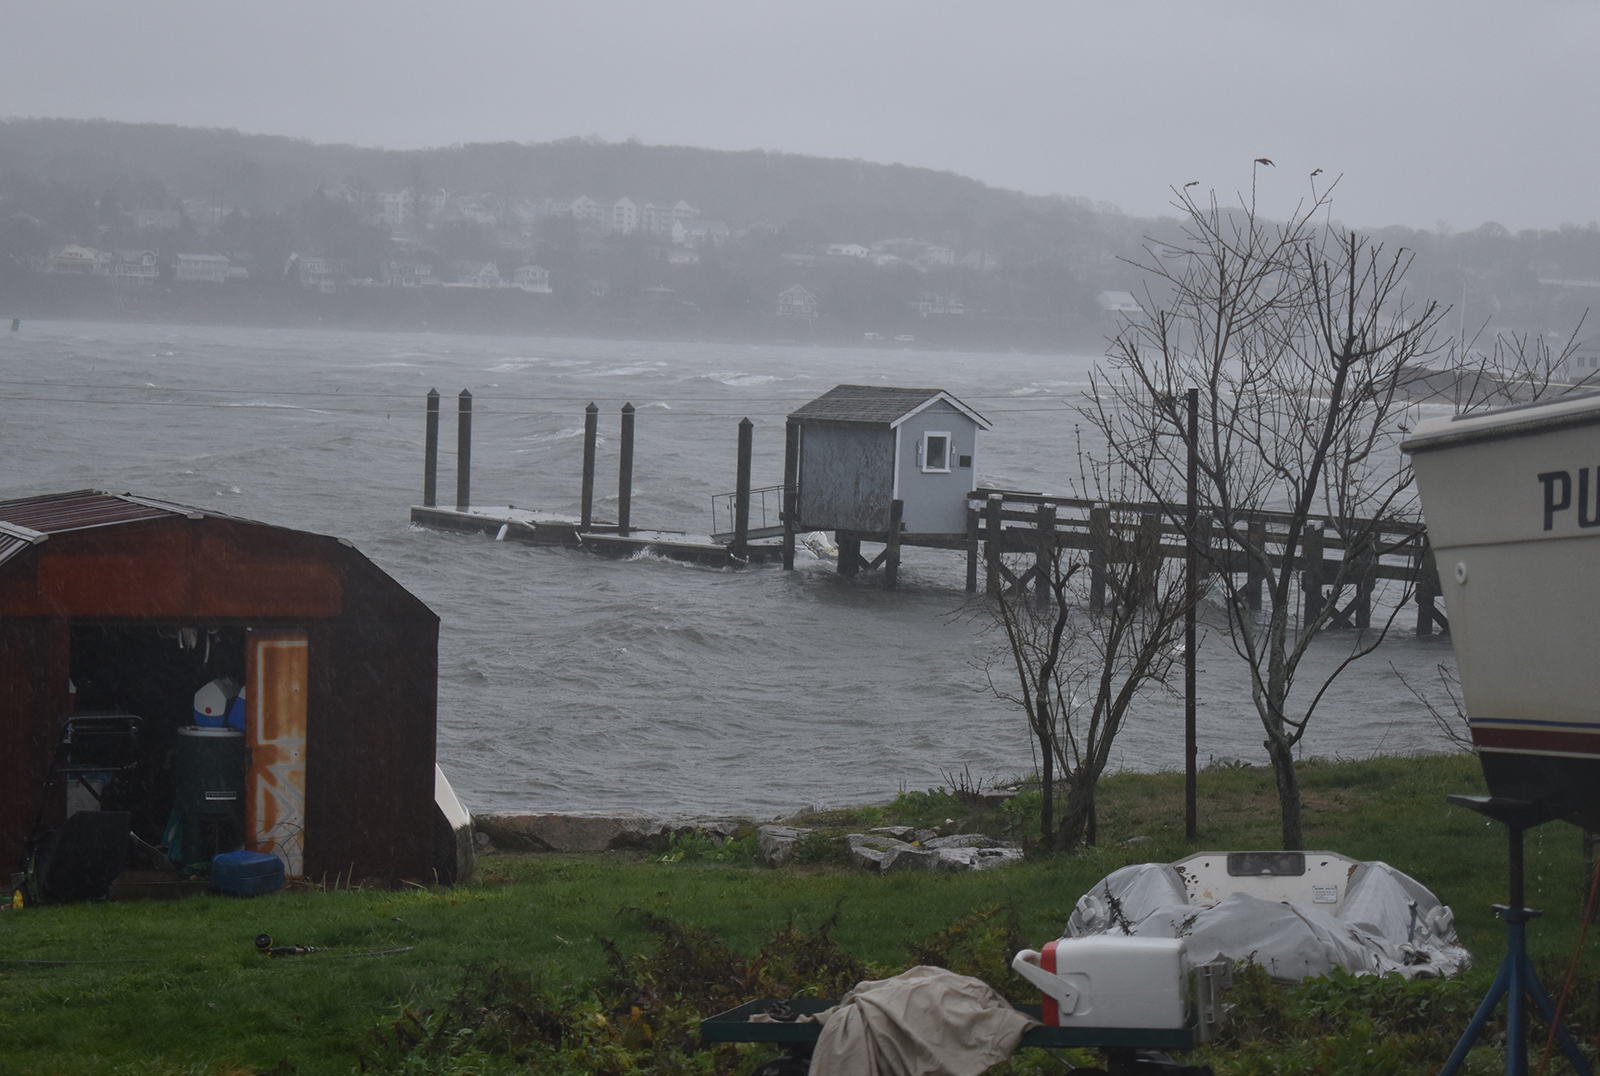
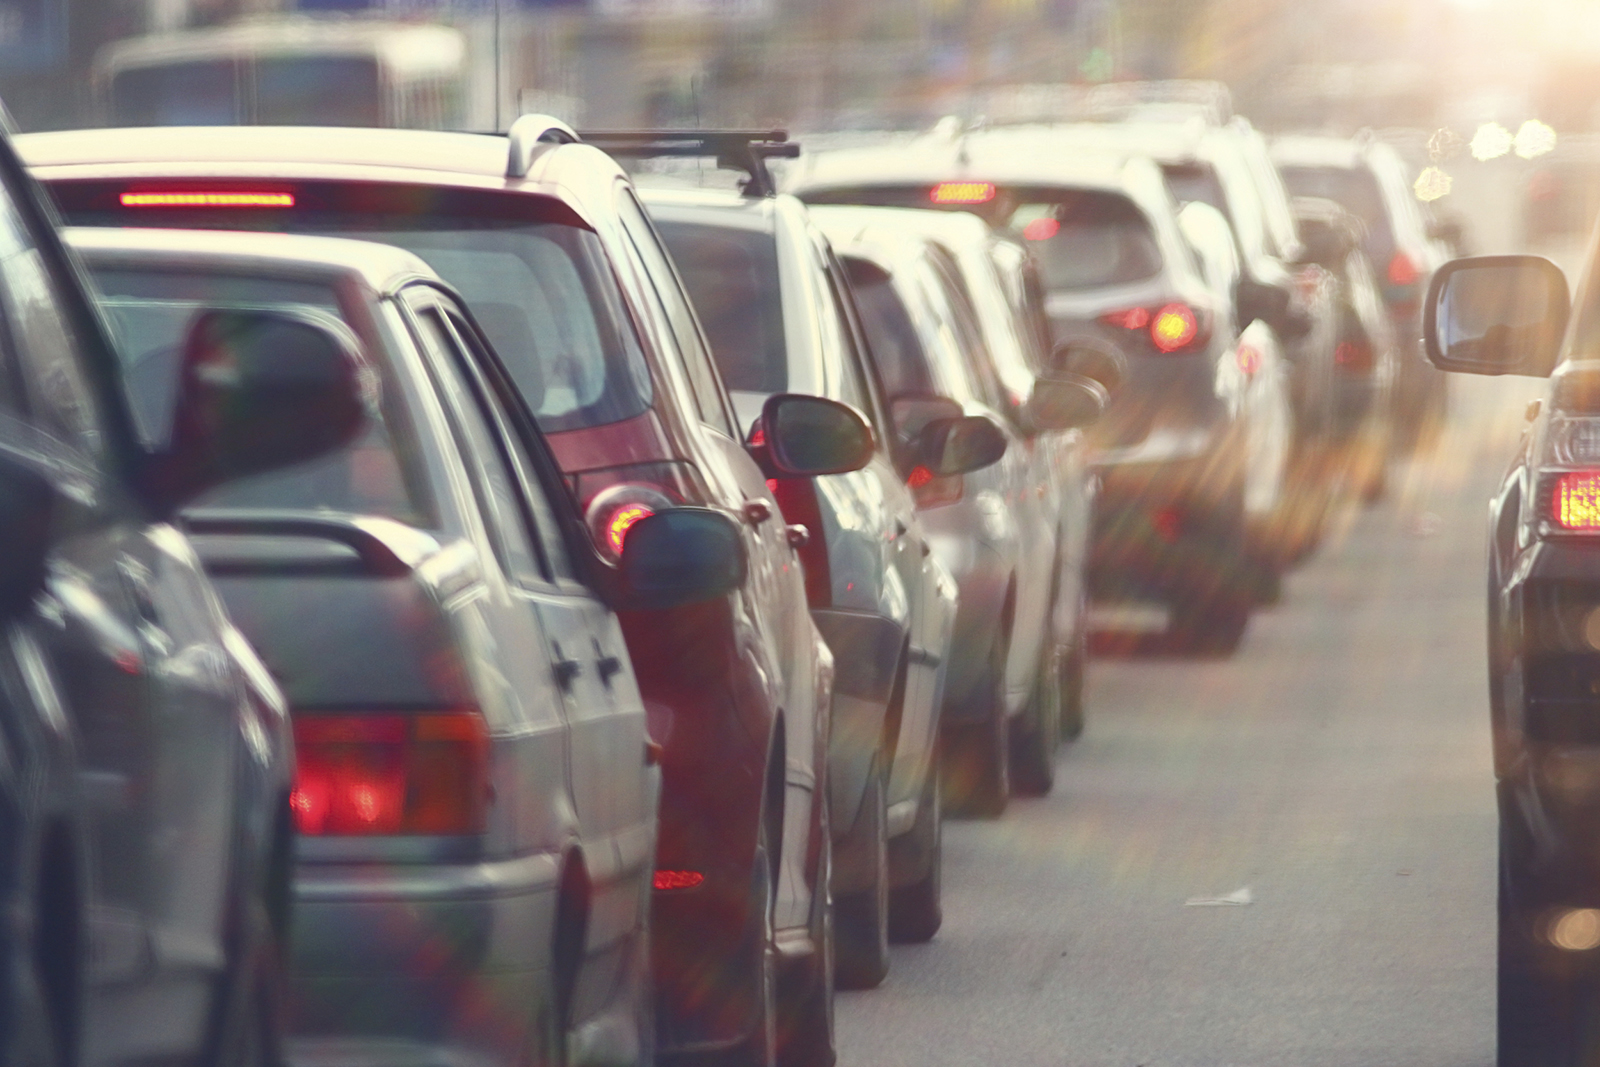
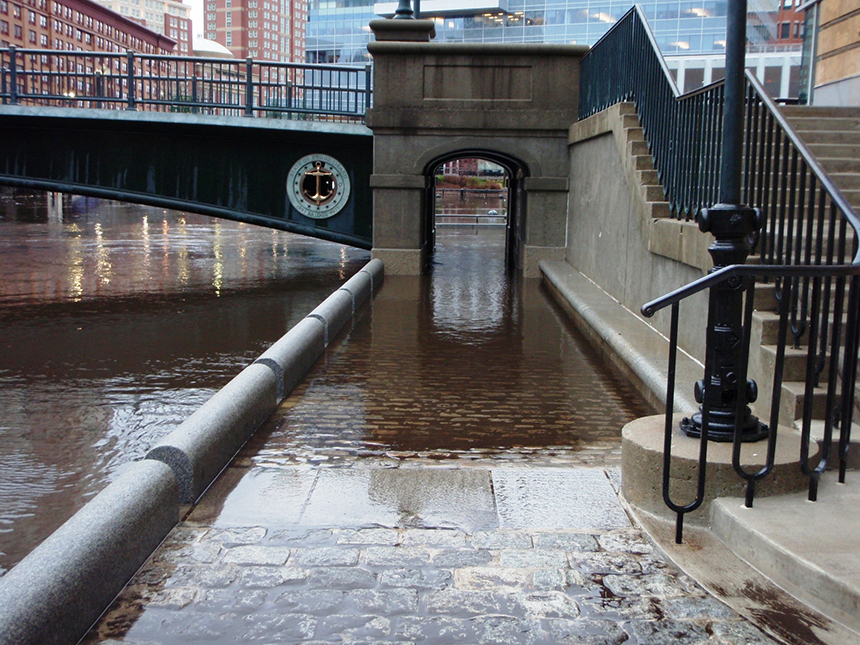
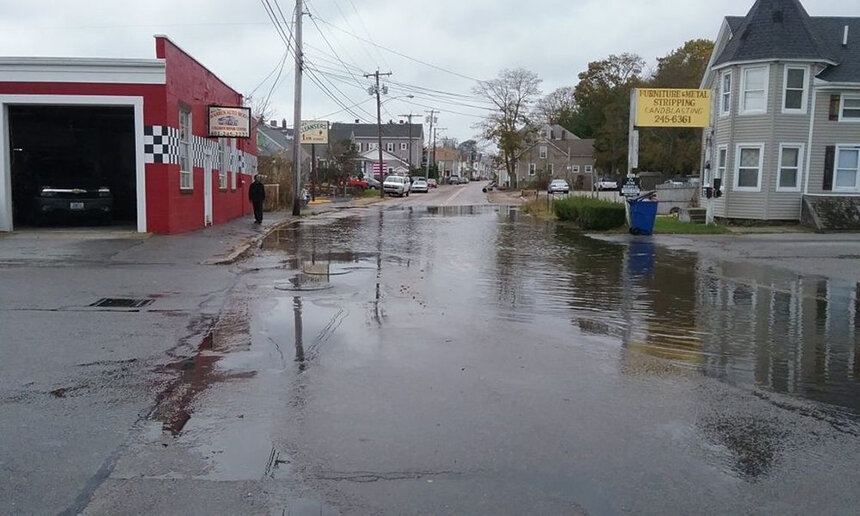
Interstate 95 shut down by flooding, Newport’s iconic First Beach battered by winter storms, neighborhoods in Cranston and Johnston underwater during heavy rainfall — these are just some of the recent extreme weather events that have hit Rhode Island.
Once, these incidents would have been described as freak events or one-offs, but all of these examples occurred multiple times within the span of a few years, a few months, and even sometimes, a few weeks.
One of the storms that led to the I-95 closure in 2022 would have been described as something close to a 100-year storm, with between 5 and 8 inches of rain failing in an hour. Twelve years earlier, the 2010 floods, which devastated huge swaths of the state, would have been considered a 100- to 500-year flooding event.
With such extreme weather events happening with increasing frequency, the question of what a “100-year storm” means these days, and how scientists and experts communicate risk to those who could be impacted by extreme rain, wind, or flooding, is shifting.
How do you calculate risk?
Isaac Ginis, a professor of oceanography at the University of Rhode Island, has seen changing storm risks in both his academic study and his personal life.
He’s seen it in the climate modeling he works on, which predicts how more precipitation will lead to more flooding around the state, and at his grandson’s favorite playground, which is often inundated with water after heavy rains.
The high rainfalls and the flooding they cause are especially worrisome for Ginis, who explained in a recent interview with ecoRI News how heavy water is and the extreme safety risk it poses for those who get caught up in it.
Accurately assessing the risk of these weather events — and thus their destruction — is a large part of Ginis’s work.
“How would you measure that risk?” Ginis asked over Zoom. “One way to think about this is the frequency of the event.”
Scientists and experts calculate the probable frequency using “return periods,” which are the amount of time on average between events.
“When they say, ‘100-year return,’ it’s actually on average,” he said. “‘On average’ because it could take place any year.” Another way of putting it: for a 100-year-storm, there is a 1% chance of the event happening within a given year.
Calculating this return period is a little tricky, Ginis explained.
The probability is calculated in part based on historical data, which varies in accuracy. Some places have more historical data than others, and older data may not be as exact because of unreliable collection methods from other eras.
That means scientists have to spend time “cleaning up” the historical data, Ginis said. For example, if there is bias in some measurements, the person analyzing the data would need to account for that.
“We’re dealing with the weather, which is, actually, inherently random,” he added. Weather varies tremendously from place to place and moment to moment, which makes it “noisy data.” That also has to be considered.
These big 100-year storm events are also rare, and thus hard to collect data on. In a perfect world, Ginis said there would be thousands of years of historical data to use.
Although referring to storms using these terms is relatively common, the return period is a statistical calculation primarily used by engineers and not the easiest or clearest concept to understand.
Still, for many people, “They think they’re seeing these events more frequently,” he said, and they’re right. “But how do you quantify this?”
How is the risk of extreme storms changing?
If the climate wasn’t changing due to the loads of carbon dioxide humans have pumped into the atmosphere by burning fossil fuels, figuring out the likelihood of future storms would be a lot more straightforward.

But it’s not.
“If you [have a] stable climate, then you can use historical data to make a projection of the future,” Ginis said, “but because our climate is changing, now historical data cannot be a good guidance.”
Scientists, including Ginis, are turning to intensive physics modeling to predict those changes.
Peer-reviewed studies (academic research that is reviewed by others in the scientific community prior to publishing) have already used modeling to show that the return period for extreme storms is shortening.
In other words, the 1% chance that a 100-year rain or flood event would happen in a given year is increasing.
“Climate models project that due to global warming, the frequency of such events is increasing,” Ginis said. “As a result, what was previously considered 100-year rain events may become 25-year rain events due to the shortening return period.”
In the engineering world, where this terminology largely applies, rather than changing regulations by changing the definition of a 100-year storm, standards are getting bumped up in some cases to 500-year storms.
In May 2022, the American Society of Civil Engineers (ASCE) changed its design standards so that residential structures must withstand 500-year storm conditions, whereas previously, they only needed to handle 100-year conditions.
ASCE sets the risk level criteria that makes its way into building codes for the entire country. It also changed its rules, so that in coastal areas, engineering for structures must explicitly consider sea level rise.
Part of the reason for this change was the observation of shortened return periods, also known as increased probability of extreme weather, Malcolm Spaulding, URI professor emeritus in ocean engineering, said.
“Why would ASCE go from 100- to 500-year? They look over at [the Federal Emergency Management Agency], that does the flooding maps, and they think, ‘Oh, my God, FEMA has 40% of the expenses that they pay out for flood insurance in areas where they said that you don’t have to worry,’” Spaulding said. “So, you know, you’ve got to change the standard.”
As one of the creators of the Coastal Resources Management Council’s STORMTOOLS (which is also used by the state for permitting), Spaulding said those overseeing the tool at URI are applying for grant money to beef the modeling up to the 500-year metrics as well.
How can risk be communicated?
With all these numbers and probabilities, Ginis said he believes talking more about the impacts a storm could have might be the best way to communicate danger to those who are at risk from extreme wind, rain, and flooding.
In some ways, his work is already trying to do this.
In a project Ginis is working on with fellow URI Professor Austin Becker that is funded by the Department of Homeland Security, URI students have surveyed important facilities around the state, including medical centers, shelters, and wastewater treatment plants, to understand when they’re at risk of shutting down or failing due to bad weather.
“We’re trying to identify what we call ‘the thresholds,’ thresholds related to the weather,” he said.
For example, when looking at a facility that uses a generator, the students asked where the generator was located in the building to determine at what point it could flood. Another example he gave was of an emergency facility that used an antenna for communication. The students looked at what wind speed would cause the antenna to fail.
Using forecasts and climate modeling, Ginis can get a better understanding of how storms of varying degrees will actually look on the ground.
Instead of knowing that there is a risk of five inches of rain and a foot of flooding, the risk becomes about losing electricity or access to radio, something that’s easier to visualize and act upon.
For the public, being aware of those thresholds is really important — and an especially important one is when roads will be flooded.
“So next time when they hear the forecast, that it will be more than eight inches, and people think, ‘Wow, eight inches, then I might not be able to drive.’”
This is much better, he said, than calling the storm a 25-, 50-, or 100-year event.